Statistical Mechanics - A random walk through
physics
What is temperature? We use the term all
the time, and we know what it means - how hot something is. What does hot mean?
Something that's at a high temperature. How about heat? That's what you get from
something that's hot - i.e. at a high temperature. See the problem? Although we
can work with heat, hot (or cold) and temperature it's hard to define them
without the cyclic result above. There's another way that involves, strangely
enough, statistics.
First, a brief problem in probability -
the classic "random walk" problem: A drunk stands at a lamp pole and
decides to walk along the sidewalk. The sidewalk is straight but not necessarily
level and the drunk is unable to control which way he steps (except that he
manages to keep on the sidewalk, avoiding the gutter). Question: Assuming that
he takes steps of equal length with equal probability that the steps are right
or left, where will he be after a total of N steps?
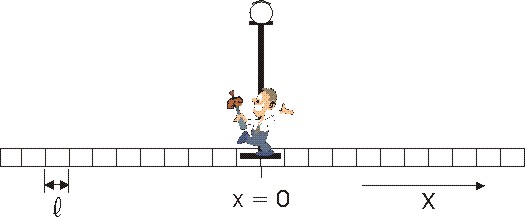
Call the length of each step µ
and the probability of a step to the right p. Then the probability of a
step to the left is 1 - p, which we can call q. In general,
because the sidewalk may not be level, p !
q - i.e. he may be more likely
to walk down hill rather than up. Choose the origin to be at x = 0. The
situation then looks like that in the diagram. Stating the question differently,
as each step is of length µ , the man must be
at a position x = m µ after N steps, m
being an integer. If m is zero he ends up where he started; if positive
to the right, and if negative to the left. Clearly m lies between -N and
+N (or may be at either extreme). Our task is to find the probability P(m)
that he is at x = m µ after N steps
(e.g. what the chance is that x = 0, or x = 3 µ
or some other stated position).
Call
nr the number of steps taken to the right and nl
the number of steps to the left. then N = nr + nl
. Also, m = nr - nl since m
was chosen to be positive for steps to the right. Using these two
relations provides m = 2 nr - N which indicates
that m is even or odd as N is. As each step is, because of
our friend's condition, independent of the earlier ones, the probability
of a particular sequence of steps is just the product of the individual
probabilities. As a familiar example, flipping a coin once gives equal
probability (50%, or 1/2) of heads or tail and flipping it again provides
the same equal chance for heads or tails on the second try. However the
probability of both tosses yielding a particular result (both heads, say)
is only 25%, or 1/4. The outcome of the coin toss can be H-H, T-T, H-T or
T-H. the probability of any particular one of these outcomes occurring is
the product of the individual probabilities - 1/2 * 1/2 = 1/4. A
particular outcome for 3 tosses would be 1/2 * 1/2 * 1/2 = (1/2)3
= 1/8 and for n tosses (1/2)n. In our random walk case
the probability is p for right steps and q for left steps,
so for nr steps to the right and nl
steps to the left the probability of a particular outcome is

Of course, many of the outcomes may
have the same end result - there are many sets of steps that will get the
drunk back to the lamp pole, and in the case of the coins the H-T and T-H
outcomes are distinct only if they are identifiable - say one coin is
painted red and the other green - otherwise they can be considered to
represent the same outcome. In this case there are only 3 possible
outcomes H-H (25%, or 1/4); T-T (25%, or 1/4); and H-T (50% or 1/2). In
fact, the number of distinct outcomes is

|
 |
You
can test this on the coin toss: There N = 2, nr
the number of heads and nl the number of tails. For 2
heads and 0 tails the number of possible outcomes are 2!/2! * 0! = 1; for
1 head and 1 tail 2!/1!*1! = 2. You may be better convinced if you try three or
four coins. Just note that the coin toss is the same as the random walk if the
walk uses equal probabilities for right and left steps (and the coins are
"fair"). Another look at the reasoning behind this result can be found
here.
So - when the number of distinct outcomes
is included, P(nr) - the probability of taking nr
steps to the right out of a total of N steps (and so nl
steps to the left) is given by
where I have used nl
= N - nr and q = 1 - p.
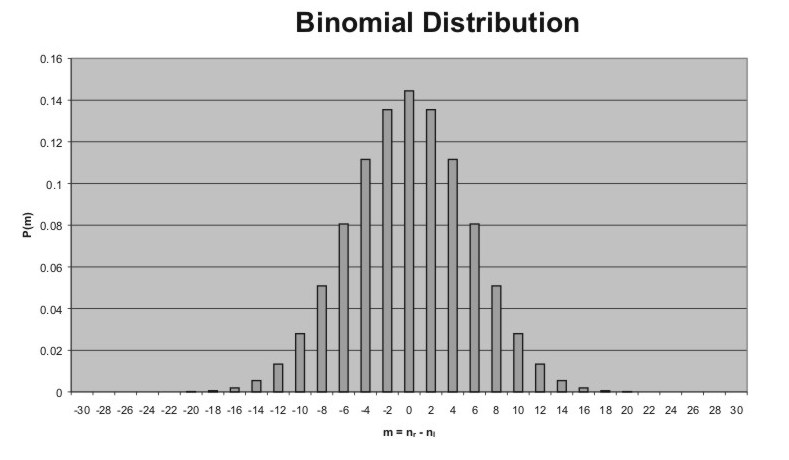
| The probability P(nr)
is called the binomial probability distribution. The
characteristics of a series of events governed by this distribution (like
our random walk) are displayed as the familiar pattern shown to the right.
There our drunk has taken 30 steps with equal likelihood of them being
left or right. The probabilities for -30 to +30 steps net
displacement from 0 are shown, using the relations N = nr + nl
and m = nr - nl . Again recall that m
must be even if N is even. As you would expect for a level
sidewalk our friend will most likely make no progress at all, but rather
end back where he started. This is not unexpected - you may have guessed
the outcome. You also might guess that the average number of steps to the
right is just N*p and to the left is N*q. (You can check
this by noting that for 30 steps on level ground N*p =
30*(1/2) = 15 , and N*q = 15, leaving on average our
drunk back at the lamp post. As a further check you can see that these
values provide the required result
where the bars over nr
and nl
indicate their average values N*p and N*q as mentioned
above. In terms of the displacement m, since m = nr - nl the
average displacement is given by
which for p = q gives
the net displacement of zero shown. |
 |
We need to have one more piece of
information: How broad is the distribution of values about the average
(the so-called standard deviation), or even more revealing, how does this
deviation from the average depend on the number of steps - i.e. the
relative deviation? The answer involves more math than we can afford here
(see Ref #6),
but the simple result is that the relative deviation,
i.e. the ratio of the deviation to the average number of steps, is proportional
to the reciprocal square root of N :
Thus
as N (and so nr ) gets larger the relative
spread in values about the average gets smaller.
Some graphs may make this clearer: Below are distributions for N = 10,
100 and 1,000. The sharp decrease in the relative widths of the curves
is immediately obvious.
The sharpness of the distribution is the
key. As the number of events gets large the variation from the average outcome
gets (significantly) less. This is the statisticians dream - with large enough
samples the chances of predicting the outcome increase. In this sense the
physicist is in an admirable position - the behavior of gas molecules in a
container involve values of N on the order of 1023!
|
Here's a simple
example: A container (perhaps of total volume 1 liter) is partitioned into
two equal parts. On the left side of the partition there are 4 gas
molecules, on the right side none. The partition is removed and the system
(the container and the molecules) is allowed to reach a final state of
equilibrium. Where are the 4 molecules? To answer this we apply the
lessons of the random walk (or, for such a small number of possible
arrangements, simply count the possibilities). Each molecule has an equal
chance of being on the right or on the left; p = q = 1/2. Then for
4 molecules there is a 1/16 chance none will be on the right. The
probabilities for 0, 1, 2, 3 or 4 molecules being found on the right side
are shown to the left. If instead there were 100 molecules the chance of
there being none on the right becomes 7.9 x 10⁻³¹ - a
fantastically small number! The molecules are always moving around and are
equally likely to be on the right or the left at any given time. If you
took a snapshot of the arrangements every second you would have to wait,
on average, 4 x 10²² years (10 billion times the age of the
universe) to get a picture of them all bunched on the same side. Conversely,
the probability of the molecules being evenly distributed between the two
sides is 0.08 - fairly likely by comparison. This value obviously drops rapidly on either side of the average
(as in the curves above). |
Number on
the right side |
Probability |
| 0 |
1/16 |
| 1 |
1/4 |
| 2 |
3/8 |
| 3 |
1/4 |
| 4 |
1/16 |
This is just counting - how does it tie
in with science? The example above depended on each possible state of the
molecules (i.e. right side or left side) being equally accessible. If there were
many partitions rather than just 2 the situation should still hold - no position
is more likely than any other. Further, if a constraint on the number of
available states of a system is released (i.e. more states become available, as
when the partition above is removed), these newly available positions will
quickly be populated. Why? Because it is highly unlikely that they won't. The
final equilibrium situation will thus be the one in which the number of states
is maximum. This does not forbid variations from this equilibrium condition,
just as flipping 100 coins will not always (or usually) result in exactly 50
heads and 50 tails., but the variations about equilibrium will small and, when
the system does find itself in a non-equilibrium state it will quickly retreat
from it.
Suppose we replace the available cubby
holes with some other available state - say the energy of a molecule of the gas,
or with a combination of characterizations of the molecules that make up their
energy, such as position, momentum and perhaps rotation (if they are complex gas molecules such as carbon
dioxide). Now there are hugely more available states for the system, but they
still should be occupied an a way that is most probable and, as in the simple
container of gas described above, the most likely state is a uniform
distribution. More so, it would be fantastically unlikely that the system would
stray very far from this equilibrium condition at all. As a simple measure of
the number of available states, consider a container of gas with N
molecules. The energy of this system is E = K + U + Einternal ,
where K and U are the system's kinetic and potential energies and Einternal
represents the internal energy of the molecules, due perhaps to their complex
structure. In the case of an ideal gas (where the molecules are considered to be
points) the internal energy would be zero. It follows then that the total number
of states of a system S =
VN F(E), where F(E)
is the total of all the possible combinations of momentum and position for all
the molecules - i.e. the available energy states. If N is of the order of
Avogadro's number (1023) the number of available states is indeed
large.