We have seen that distance, velocity and acceleration were connected mathematically by the areas under the curves representing these quantities. I've redrawn them below. Now look at an analytical representation of the curves - i.e. the curves (and so the quantities) represented as equations:
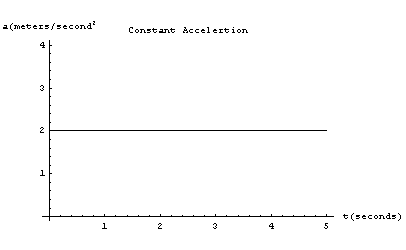 |
The acceleration is constant - this is where we started. As an equation we write a = 2. To be more general we can simply say the acceleration is a constant we call a. The velocity is the area under the acceleration curve - we figured this out last time. Area is height times width, so
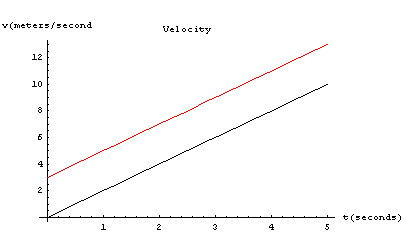
This is the equation of the straight line of the second graph. The distance vs. time graph is a measure of the area under the velocity curve, the area of a triangle, half the base (t) times the height (v), or
where in the term on the right I used the value of v from the first equation. We need to be a bit more general: Suppose our accelerating object was not at rest at time zero, but rather was moving with velocity vi. This velocity would have to be added to that caused by the acceleration. It would look like
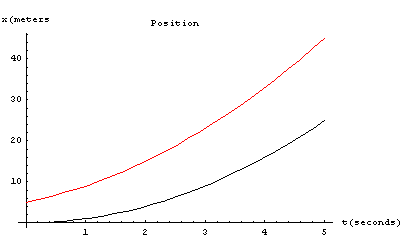
as shown in red - the whole curve is just raised by the value of vi. Of course, this added velocity will also add more distance to the third curve. The added distance is equal to a rectangle of height vi. and width t. The position will then be given by Finally, in case the initial position of the object was not at the origin we add an initial position xi (= 5 in red) to get
|
 |
|
 |
The equations
![]()
![]()
are called Galileo's equations after the man who experimentally discovered them in the early 1600's. They apply only to the case of constant acceleration, provided by gravity in Galileo's case.
All the above assumed we have a constant acceleration (a). Because the acceleration of gravity near the surface of Earth is constant, the results are very useful, as Galileo found out. What if a is not constant? Fortunately the process of using areas under curves to relate acceleration, velocity and position (and many other such physical quantities) is quite general. No matter how complex the curve (except for a few, mostly non-physical exceptions) the process still works. The difficulty arises in trying to figure the areas for complex curves; the solution lies in the calculus.
Calculus comes in two flavors: Integral and differential. Integral calculus calculates areas under curves; differential calculus calculates slopes of lines. (Mathematicians may cringe at such simplifications, but they are essentially true). Fortunately there are some "tricks" that allow calculating areas and slopes in a straightforward way, without a formal exposure to calculus. This is not to minimize the value of a thorough exposure to calculus as is found in a formal course on the subject, because such exposure allows greater insight into the strength and beauty of the calculus, but a working ability can be achieved quite easily.
First, we recognize that there are relatively few mathematical forms. I list a few here:
Algebraic, involving only powers of the variable: 3x3 + 3x +4
Trigonometric, involving sines, cosines, etc: sin(3x) + tan(4x)
Logarithmic, involving natural and other base logarithms: log(x) + ln(y)
Exponential, involving terms with variables in the exponent: ex + 10x
All such expressions may have constants as multipliers or as added terms, as does the algebraic example and, of course, various combinations of the above are commonplace.
For openers we look first at the algebraic form. To find the area under a curve defined by an algebraic expression we use the following "cookbook" formula (the advantage of taking a course in calculus is that it shows you why the formula works). As we are dealing with time as a variable in our present work, that's what I will use here. More general forms will follow as needed.
To find the area under a curve we essentially break the region of interest into small rectangles (the areas of which are easy to find), and add up these areas. We write
![]()
This tells us to add up (the integral sign, essentially a long "S" for summation) the areas of a very large number of tall (height f(t)), skinny (width dt) rectangles. Understand that the integral sign and the dt together are just the instructions of what you are to do to f(t) (add up the rectangles). It's like the multiplication sign in 3 X 4 = 12. One is an operator that tells you to integrate, the other an operator that tells you to multiply. We can specify a starting point (e.g. from a to b), or keep it general. For an algebraic function, f(t) might look like 3t3 + 3t +4. Here's the rule for performing this integration:
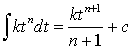
In other words, bring any constants along without change (k just carries from left to right side), increase the power of t by 1 (n becomes n+1) and divide the whole thing by n+1. It is also necessary to add a constant c, for reasons to be seen later. For an expression with several terms, treat each term separately. For example,
![]()
You might want to write the 4 in the last integral as 4t0 (since t0 is just 1) to get the term into a form to match my cookbook formula. The final result is the sum of these, and since each constant is as yet arbitrary, I can add them to get another (equally arbitrary) constant c. After some simplification I have
![]()
If you try this for the case of f(t) = a = constant you will arrive at Galileo's equations. Try it - and see why we need the "arbitrary" constants.
![]()